/ 8 分钟阅读
本文最后更新于 1683 天前,文中所述的信息可能已发生改变或更新。
配置文件
和 K8s 一样,prometheus 也是一个配置驱动的系统,了解配置是关键,后面的小节会覆盖不少细节,现在暂时粗略预览整个配置文件的结构:
global:
# How frequently to scrape targets by default.
# 抓 target 的频率
[ scrape_interval: <duration> | default = 1m ]
# How long until a scrape request times out.
# 超时时间
[ scrape_timeout: <duration> | default = 10s ]
# How frequently to evaluate rules.
# 计算 rule 的频率
[ evaluation_interval: <duration> | default = 1m ]
# The labels to add to any time series or alerts when communicating with
# external systems (federation, remote storage, Alertmanager).
external_labels:
[ <labelname>: <labelvalue> ... ]
# File to which PromQL queries are logged.
# Reloading the configuration will reopen the file.
[ query_log_file: <string> ]
# Rule files specifies a list of globs. Rules and alerts are read from
# all matching files.
# 一组 glob(带通配符的文件地址),读取文件中的规则和告警
rule_files:
[ - <filepath_glob> ... ]
# A list of scrape configurations.
# 抓取配置,可以分组配置 exporter
scrape_configs:
[ - <scrape_config> ... ]
# Alerting specifies settings related to the Alertmanager.
alerting:
alert_relabel_configs:
[ - <relabel_config> ... ]
alertmanagers:
[ - <alertmanager_config> ... ]
# Settings related to the remote write feature.
remote_write:
[ - <remote_write> ... ]
# Settings related to the remote read feature.
remote_read:
[ - <remote_read> ... ]
在 prometheus GitHub 仓库里有一份推荐参考的配置文件,写配置时感到迷惑可以看看。
基本流程
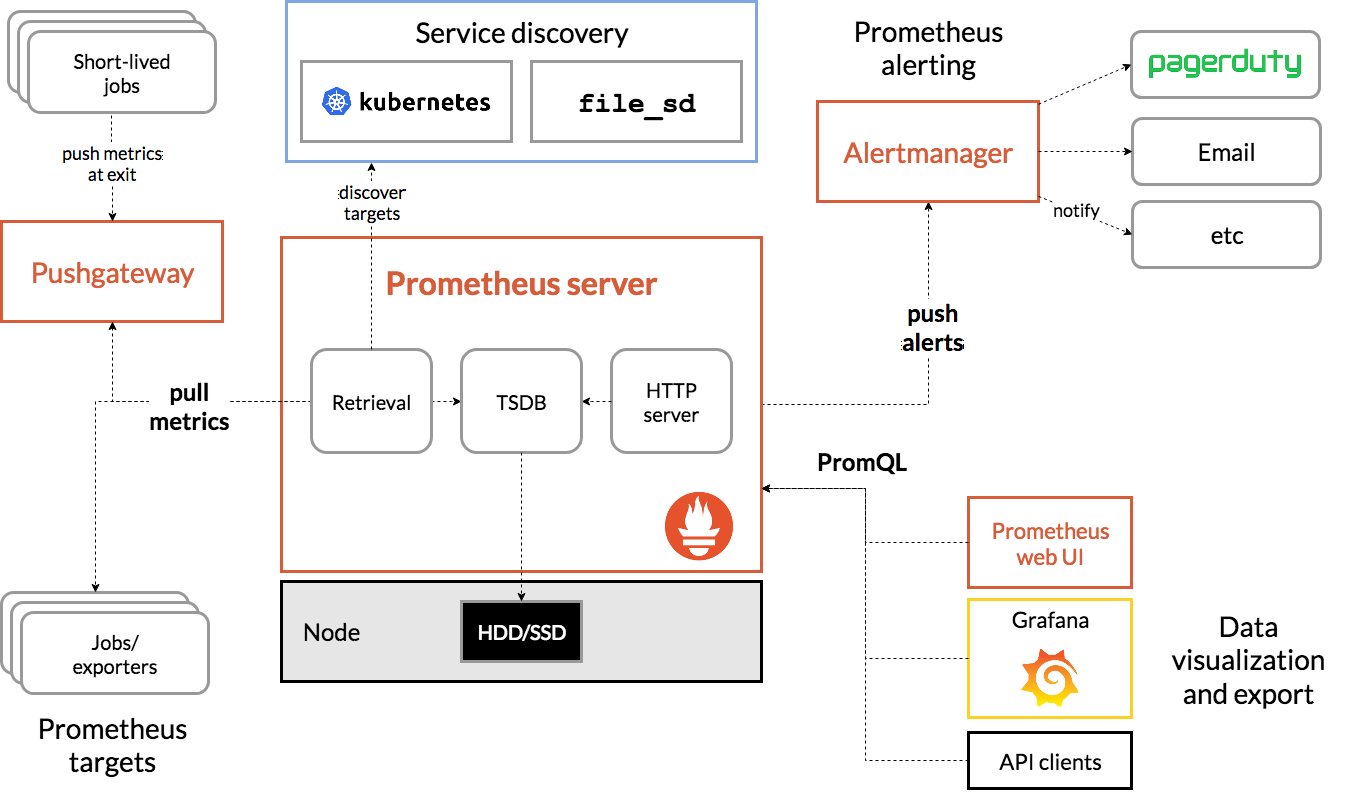
Prometheus Server 收集 exporter 或 job 的数据,推送到 Alertmanager;同时,Grafana 和 API 客户端可以使用 PromQL 向 Prometheus Server 查询数据。
要对对象进行监控,首先要在监控目标设置 exporter,常见例子有 node_exporter。
Exporter
要知道 node_exporter 暴露了怎样的数据,在正确安装 node_exporter 后,可以通过 http://192.168.41.128:9100/metrics 访问 metric 的内容,大概会像这样:
# HELP node_disk_io_time_seconds_total Total seconds spent doing I/Os.
# TYPE node_disk_io_time_seconds_total counter
node_disk_io_time_seconds_total{device="dm-0"} 903.864
node_disk_io_time_seconds_total{device="sda"} 903.688
node_disk_io_time_seconds_total{device="sr0"} 0.156
node_disk_io_time_seconds_total{device="sr1"} 0.124
# HELP node_disk_io_time_weighted_seconds_total The weighted # of seconds spent doing I/Os.
# TYPE node_disk_io_time_weighted_seconds_total counter
node_disk_io_time_weighted_seconds_total{device="dm-0"} 387.796
node_disk_io_time_weighted_seconds_total{device="sda"} 38.02
node_disk_io_time_weighted_seconds_total{device="sr0"} 0.024
node_disk_io_time_weighted_seconds_total{device="sr1"} 0.008
# HELP node_disk_read_bytes_total The total number of bytes read successfully.
# TYPE node_disk_read_bytes_total counter
node_disk_read_bytes_total{device="dm-0"} 7.86113536e+08
node_disk_read_bytes_total{device="sda"} 7.97292544e+08
node_disk_read_bytes_total{device="sr0"} 1.8208768e+07
node_disk_read_bytes_total{device="sr1"} 1.8243584e+07
不只是 node_exporter,所有 exporter 输出的数据都符合这样格式,其中包含三类内容:
# HELP开头的是帮助信息# TYPE开头的是 metric 类型,也就是上面提到的 Counter、Gauge、Histogram、Summary- 其他的都是实际需要使用的数据,结构包括 metric 本体、值、时间戳(可以没有默认当前时间),用 EBNF 表示为如下架构:
metric_name [
"{" label_name "=" `"` label_value `"` { "," label_name "=" `"` label_value `"` } [ "," ] "}"
] value [ timestamp ]
数据格式先说到这,接着需要在 scrape_configs 属性中配置 job,分类抓取 exporter:
scrape_configs:
- job_name: "node"
# Override the global default and scrape targets from this job every 5 seconds.
# 可覆盖 global 配置的抓取间隔
scrape_interval: 5s
static_configs:
- targets: ["localhost:8080", "localhost:8081"]
labels:
group: "production"
- targets: ["localhost:8082"]
labels:
group: "canary"
Record rule
可以使用 record rule(不知道该如何翻译,暂且叫做“记录规则”吧)聚合成新的信息,聚合输出的规则格式是用一个 groups 指定一组 rule_group。
groups: [- <rule_group>]
rule_group 再包含一组 rule:
# The name of the group. Must be unique within a file.
name: <string>
# How often rules in the group are evaluated.
[ interval: <duration> | default = global.evaluation_interval ]
rules:
[ - <rule> ... ]
rule 格式则是这样的,重点,敲黑板:
# The name of the time series to output to. Must be a valid metric name.
record: <string>
# The PromQL expression to evaluate. Every evaluation cycle this is
# evaluated at the current time, and the result recorded as a new set of
# time series with the metric name as given by 'record'.
expr: <string>
# Labels to add or overwrite before storing the result.
labels: [<labelname>: <labelvalue>]
对于记录规则的名称,在官方文档有一些建议。
按照 groups、rule_group、rule 三层结构,把 rule 组合保存到 prometheus.rules.yml 文件,就是这样的:
groups:
- name: cpu-node
rules:
- record: job_instance_mode:node_cpu_seconds:avg_rate5m
expr: avg by (job, instance, mode) (rate(node_cpu_seconds_total[5m]))
再在 Prometheus 配置中使用 rule 配置文件:
rule_files:
- "prometheus.rules.yml"
rule 的 record 是聚合得来的新纪录的名称;expr 是聚合规则,其使用的便是 prometheus 的一大重点 PromQL。
PromQL
表达式由四种类型组成:
- Instant vector 瞬时向量
- Range vector 区间向量
- Scalar 纯量
- String 字符串
选择器:
- 瞬时选择,最简单的选择只需要使用 metric 的名称,也可以用
{}筛选标签 - 区间选择
[] - 时间偏移
Offset - 指定时间
@
Subquery 返回一个区间向量:
<instant_query> '[' <range> ':' [<resolution>] ']' [ @ <float_literal> ] [ offset <duration> ]
操作符:
- 二元操作符,包括算术运算(
+-*/%^)和比较(== != > < >= <=)两类 - 聚合操作符,
sum、max、topk等,更多请看文档
函数:看文档
The Four Golden Signals:
- Latency
- Traffic
- Errors
- Saturation
引用自 Google SRE book
一个比较靠谱的 PromQL 中文说明。可以在 promlens 分析和测试你的 PromQL。
Alert rule
除了聚合新信息还可以编写告警规则(alert rule),它的格式如下:
# The name of the alert. Must be a valid label value.
alert: <string>
# The PromQL expression to evaluate. Every evaluation cycle this is
# evaluated at the current time, and all resultant time series become
# pending/firing alerts.
expr: <string>
# Alerts are considered firing once they have been returned for this long.
# Alerts which have not yet fired for long enough are considered pending.
[ for: <duration> | default = 0s ]
# Labels to add or overwrite for each alert.
labels:
[ <labelname>: <tmpl_string> ]
# Annotations to add to each alert.
annotations:
[ <labelname>: <tmpl_string> ]
包含三层结构的一个例子:
groups:
- name: example
rules:
- alert: HighRequestLatency
expr: job:request_latency_seconds:mean5m{job="myjob"} > 0.5
for: 10m
labels:
severity: page
annotations:
summary: High request latency
在 annotations 中可以使用模板语法。
AlertManager
为了在 AlertManager 查看告警,需要在配置文件中关联 AlertManager:
alerting:
alertmanagers:
- static_configs:
- targets: ["localhost:9093"]
AlertManager 除了提供基本的告警通知能力以外,还主要提供了如:分组、抑制以及静默等告警特性。
Alertmanager 本身也有配置,文档在此,暂不展开。
Glossary
Metric
结构 = Metric names + labels
<metric name>{<label name>=<label value>, ...}
这是一个例子:
api_http_requests_total{method="POST", handler="/messages"}
Metric 类型:
- Counter
- Gauge
- Histogram
- Summary
Job
一个 exporter 就是一个 target,job 是相同逻辑 target 的集合。
Time series
数据会以 Time series 的形式存入 TSDB(时序数据库)。