¶pyImageColorAnalysisTool
This tool is designed to analysis color distribution of image based on k-means cluster.
¶Usage
¶Download
1 | git clone https://github.com/Doradx/pyImageColorAnalysisTool.git |
¶Install requirements
1 | pip install -r requirements |
¶Run
1 | python main.py |
¶Example

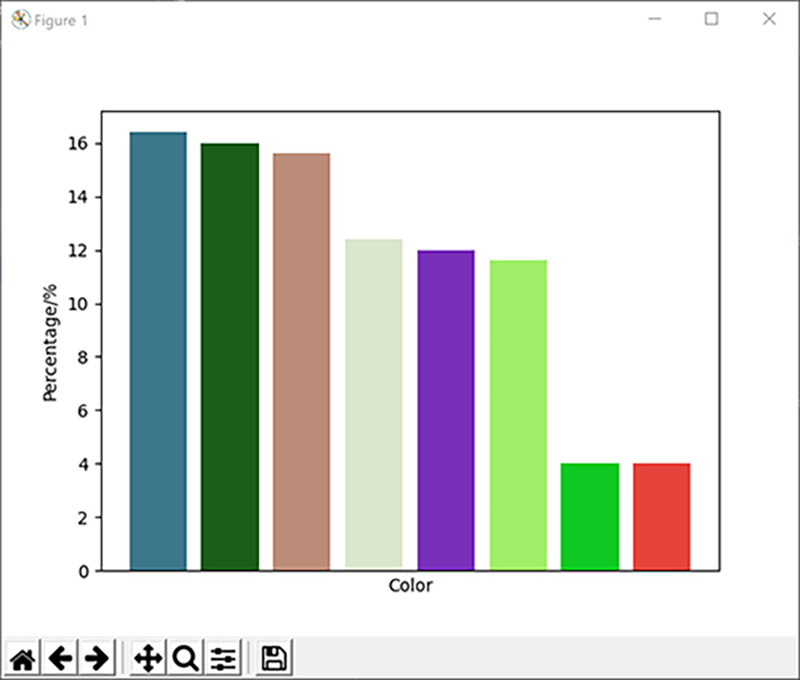
1 | 主要颜色及占比: |
¶Github
¶Author
Dorad, ddxid@outlook.com


![[徒步]宁波九龙爱心线](https://i.cuger.cn/b/d3c7f637-f0a4-4cfb-8e2b-23631aaba006.jpg)
![[徒步]仙居公盂徒步+丽人谷溯溪(多图)](https://i.cuger.cn/b/d9792528-29aa-4af0-98b5-979472c57b77.jpg)
![[出差]内蒙草原风光](https://i.cuger.cn/b/0039bc8f-15e8-4039-a286-9fb1d1af9e33.jpg)